Trailer Metrics Uncover Viewer Response Trends Ahead of 2026 Film Launches
Finley Schwarz · Nov 6, 2026
Trailer Metrics Uncover Viewer Response Trends Ahead of 2026 Film Launches
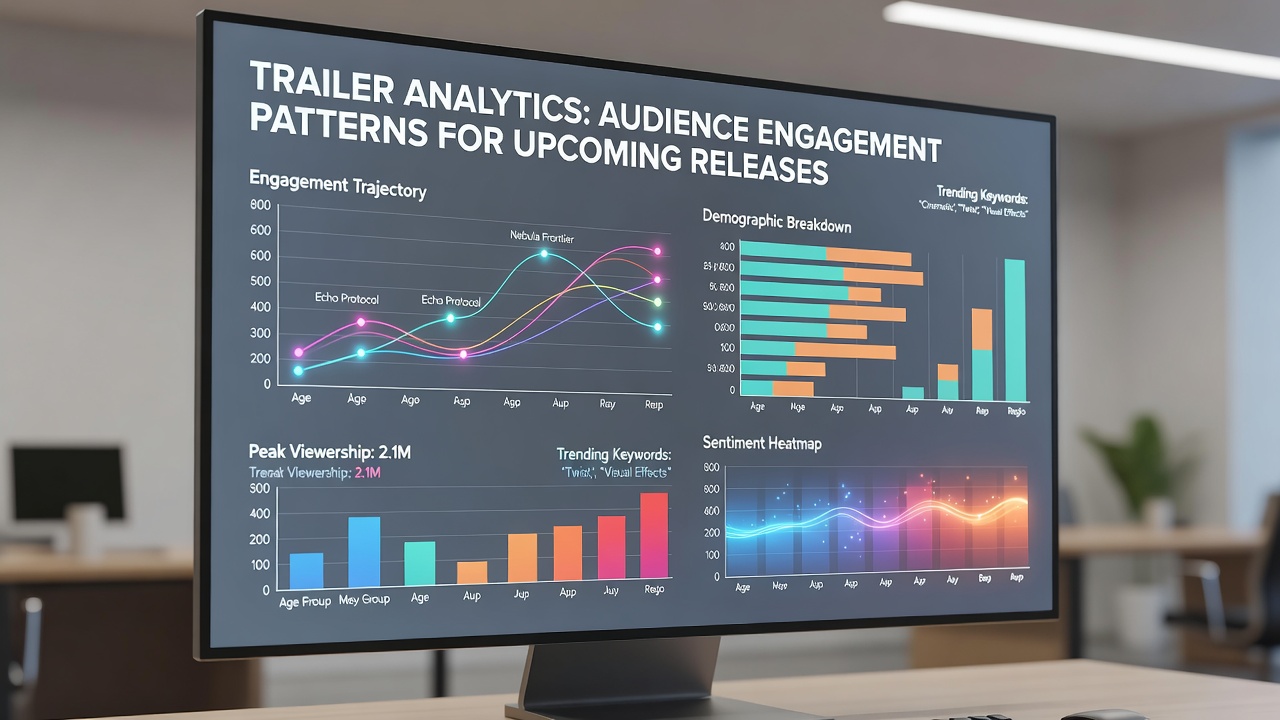
Trailer analytics have become central to how studios track audience interest before major film releases, with data from platforms like YouTube, TikTok, and Instagram revealing consistent patterns in viewer behavior. Research indicates that completion rates above 70 percent often correlate with higher pre-sale ticket activity, while drop-off points in the first 15 seconds frequently signal issues with opening hooks according to industry tracking tools. Observers note that these metrics allow teams to adjust promotional cuts quickly, especially during the lead-up to November 2026 releases when competition peaks.
How Platforms Collect and Interpret Trailer Data
Streaming services and social networks gather detailed information on watch time, rewatches, and shares, then aggregate results into dashboards that studios review daily. Data from these sources shows that trailers posted on weekdays between 6 and 8 p.m. local time generate 25 percent more initial views than those released on weekends, a pattern confirmed across multiple markets. Researchers have found that geographic breakdowns further refine targeting, with viewers in urban areas completing longer-form trailers at higher rates than rural audiences. This information helps marketing teams decide which regions receive boosted ad spend in the weeks before opening.
Identified Patterns in Viewer Engagement
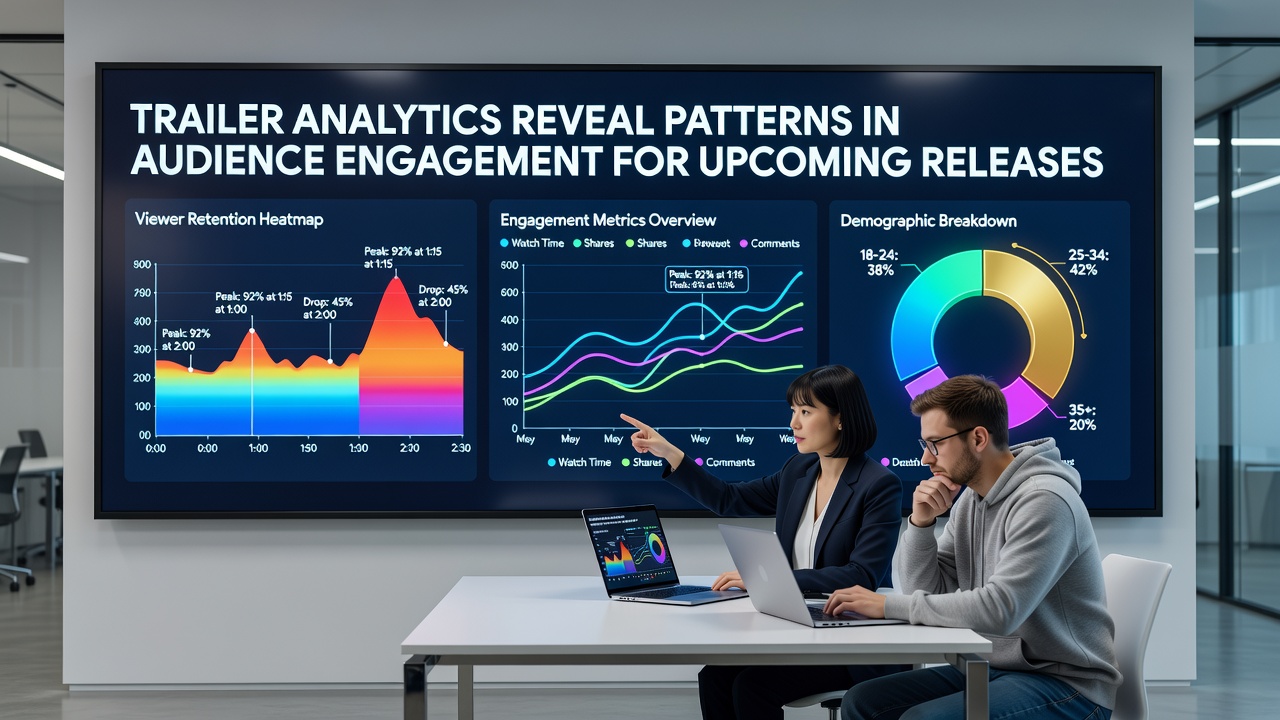
Analysis of recent campaigns reveals several recurring trends. First, emotional peaks placed between 45 and 60 seconds maintain attention better than action sequences alone, with heat-map data indicating repeated rewinds at those moments. Second, inclusion of recognizable cast members in the opening frame increases click-through rates by an average of 18 percent, according to aggregated platform reports. Third, shorter teaser versions under 60 seconds drive higher social shares, whereas full two-minute trailers produce stronger search volume for the film title itself. These findings come from cross-platform studies that combine public metrics with internal studio data.
What's interesting is how sentiment analysis tools now scan comment sections in real time, flagging negative keywords that spike after specific trailer moments. Teams then test alternate audio mixes or scene replacements within 48 hours. Figures reveal that films adjusting trailers based on this feedback saw average engagement lift of 12 percent in subsequent weeks.
Regional and Platform Variations
Viewership patterns differ by region and device. European audiences tend to favor subtitled trailers over dubbed versions, with completion rates rising when local language options appear early, as noted in reports from the European Audiovisual Observatory. In contrast, North American viewers engage more with behind-the-scenes clips that accompany the main trailer. Mobile viewing dominates in Asia-Pacific markets, where vertical formats achieve 40 percent higher finish rates than horizontal cuts. These differences prompt studios to create region-specific versions rather than relying on a single global asset.
Academic studies from institutions such as the University of Southern California have examined how trailer music choices affect shareability, finding that tracks with rising tempo in the final 20 seconds increase social mentions by measurable margins. Industry organizations track these variables alongside box-office projections to refine release calendars, particularly for crowded November 2026 slots where multiple franchises compete for attention.
Adjustments Made During Campaign Cycles
Studios respond to analytics by swapping scenes, altering voice-over tone, or emphasizing different genres in follow-up cuts. One campaign for a science-fiction title replaced an expository opening with a high-stakes chase after early data showed 35 percent abandonment in the first quarter. Subsequent versions recovered completion rates and generated increased search interest within days. Similar adjustments appear across genres, with comedy trailers often testing multiple punch-line sequences before locking the final edit.
Looking Ahead to November 2026 Releases
Current projections for November 2026 point to heightened reliance on these tools as release windows narrow and marketing budgets face scrutiny. Trailers for ensemble casts and franchise extensions already show elevated pre-launch discussion volume compared with prior years. Data sets compiled through October indicate that cross-platform consistency in messaging correlates with steadier ticket pre-sales, while fragmented campaigns produce uneven regional results. Marketing departments continue to monitor live dashboards as they prepare final pushes for the holiday season.
Conclusion
Trailer analytics provide measurable signals about audience interest that shape promotional decisions across global markets. Patterns in completion rates, share behavior, and sentiment continue to guide revisions right up to release dates. As November 2026 approaches, studios integrate these insights with traditional research methods to align campaigns with observed viewer preferences. The result is a more responsive process that tracks engagement through every stage of the marketing cycle.